Harness-Monitor
Got tired of running my harness by feel. Built a dashboard that shows token trends, sessions, and config on one screen.
Role
Data layer design, local collector, dashboard UI
Tags
Links
Highlights
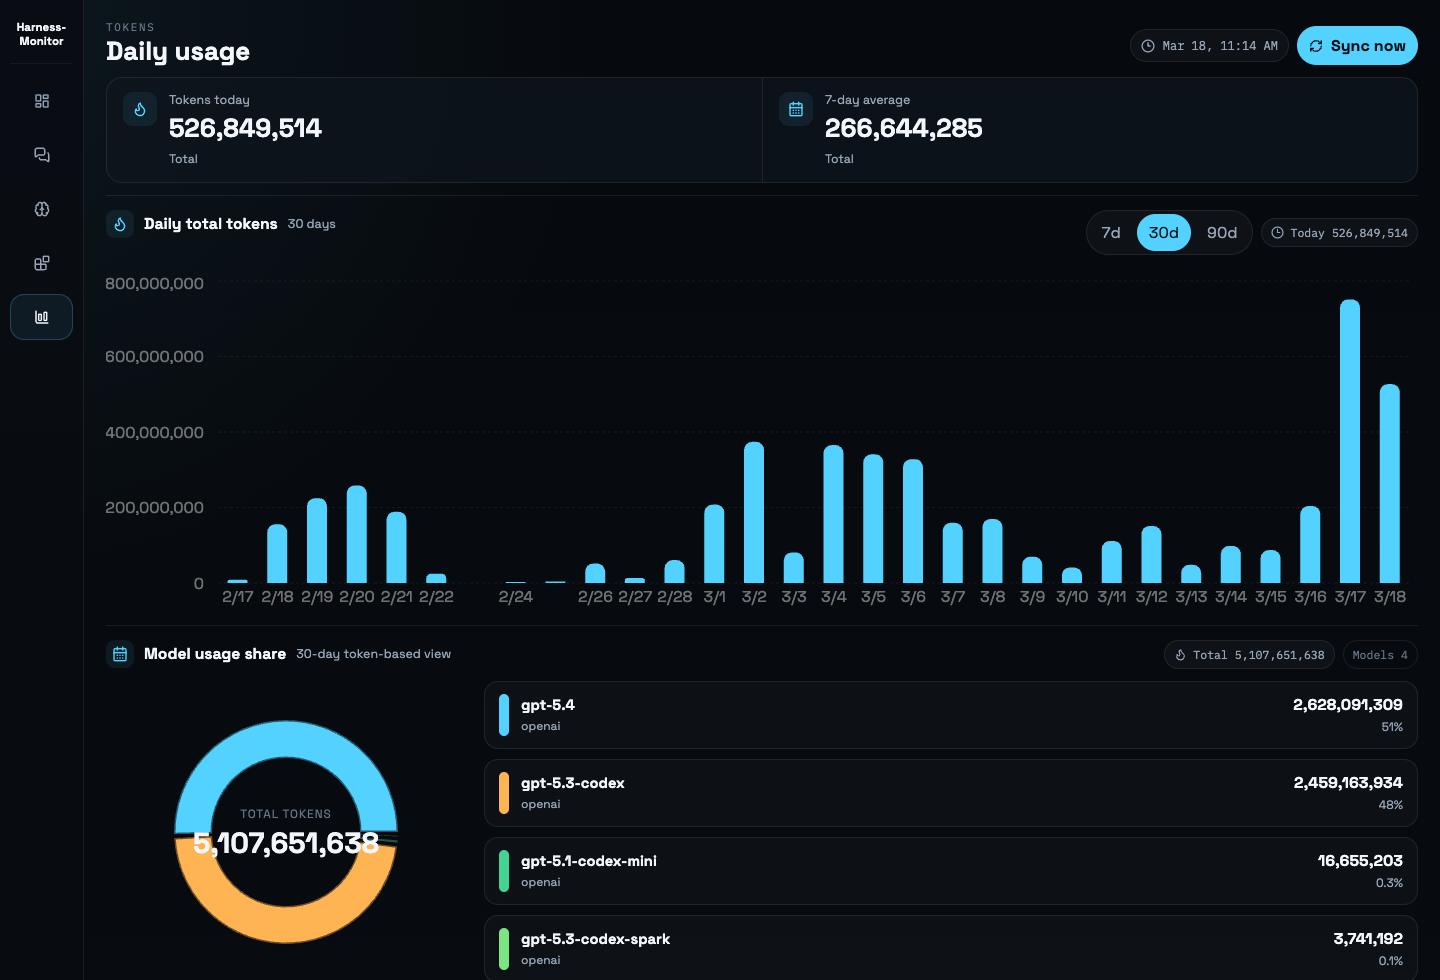
- Token trends and per-project usage breakdown
- Session history and integration status browsing
- Tracks both Codex and Claude Code in one dashboard
Run a harness long enough and important info hides in scattered local folders. Sessions, memory, skills, MCP, hooks, token events — all somewhere on disk. Most people don't even know these exist. So I put them on one screen.
Named it Harness-Monitor, not codex-monitor. Codex at home, Claude Code at work — both tracked in one place now.
Reads ~/.codex, ~/.claude, and token_count events, then regroups by project, model, and date. Token page, sessions page, and Integrations page show usage trends, conversation history, and config status together. Provider-specific data layers keep the architecture extensible.
Watching token trends is surprisingly emotional. Some days feel productive, others draw "that's all?" Ends up as a self-audit of how hard I'm pushing the harness.
Next: session sharing, token trend sharing.
Links
GitHub at the link above. Related posts in the hub below.